A Close Look at Sea Level Rise
Causes and importance
Anthropogenic climate change has lead to an increase in sea levels during the last century. There are two primary mechanisms for this, the first and more obvious is the melting of glaciers on land putting more water into the ocean, the second is thermal expansion due to the increase in ocean temperatures. I find that people are often surprised by the second mechanism because they think of thermal expansion as a small change, the key thing to remember here is that a change on the order of a few feet is small given that the average depth of the ocean is over 12000 feet!
The consequences of sea level rise are serious and deserve consideration. Commerce is incredibly important to our modern economies, historically this has meant that major cities were built close to the ocean. Even if low lying cities aren't in danger of sinking into the ocean the higher sea level make storm surge a bugger problem; hurricanes also lose a lot of energy when they hti the land, pushing coastlines inland means storms will be more powerful when they hit populatied areas.
The Data
For simplicity I'm focused only on the East Coast of the United States. Below is pictured the sea level in millimeters by year at 5 locations.
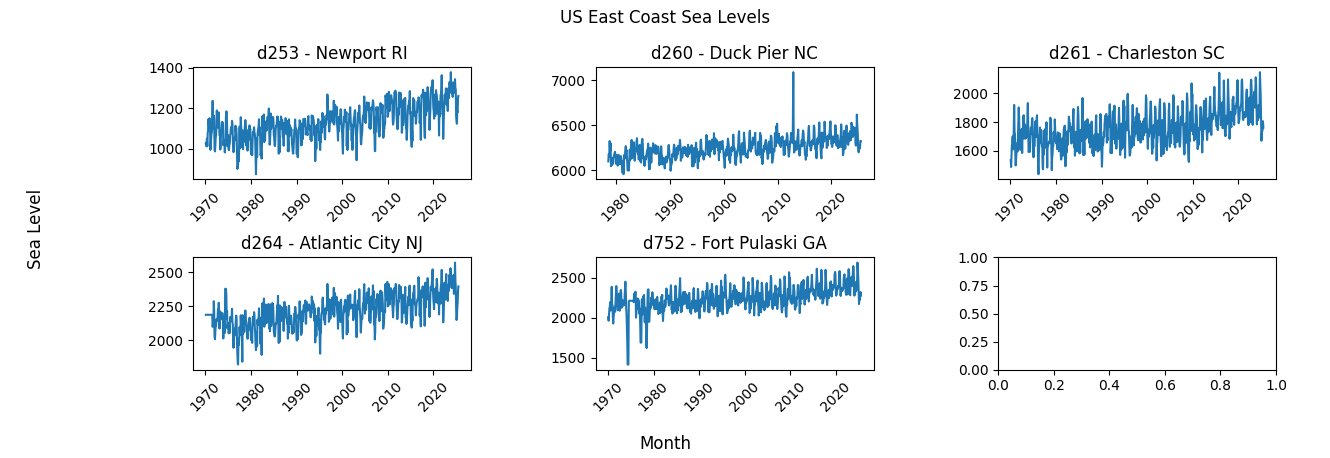
The ranges are wildly different between locations because they are measured against a fixed reference point at each site. for this reason it's common to graph the "anomoly", that is, the distance from the mean over the whole time series. There are two things we need to deal with to make this data easier to work with. First, we can see outliers that are either a result of error or possibly natural disaster; these point need to be removed so that they dont bias our analyses. Second, we want to average the data by year since the seasonal variability is of no interest for our purposes.
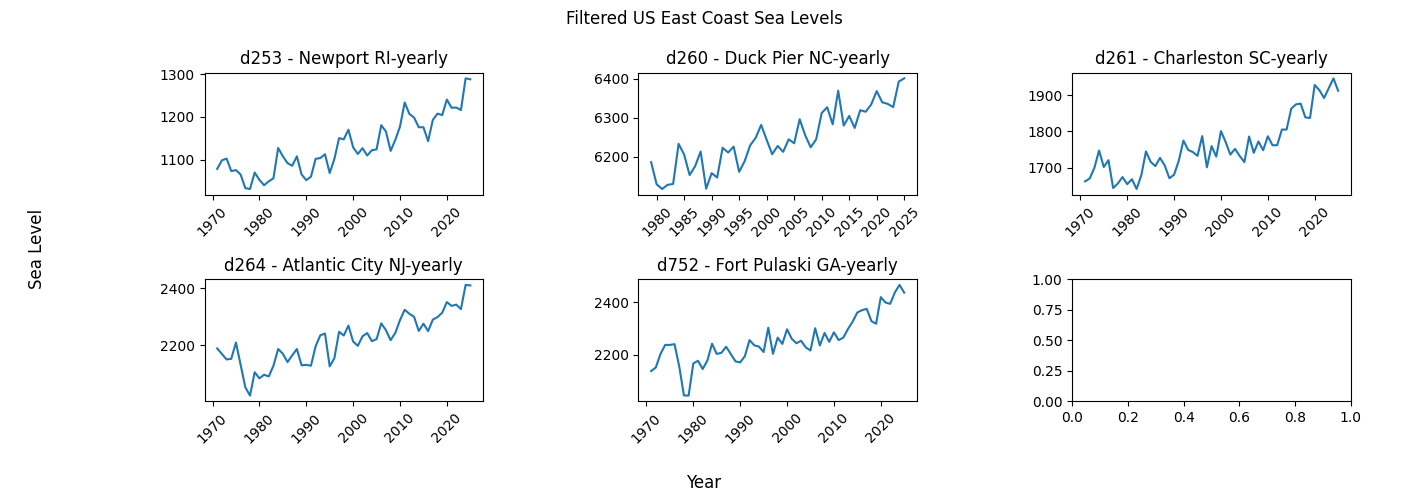
We could remove outliers by hand since they're aren't thaat many and we're looking at just 5 locations but I wanted to design my analysis to be flexible enough to work on it's own in the event that I want to try it on more or different data. To achieve this we're filtering out points based on z-scores; the catch here is that since our data is obviously non-stationary, it has a trend that isn't just flat. If we simply take the z-score of the sea level data an outlier in the early part of our data might be missed since that value is "typical" later in the time series. To handle this we'll do an inital fit of the data and then compute the deviations from that trend curve, those deviations will give us a stationary time series that we can then filter based on the z-scores (Please see ending notes for nuances about this method and alternatives that may in general work better).
With the data appropriately filtered we compute the average level for each year so we don't see the seasonal variations, allowing us to focus on the long term trend.
Change at a Given Time
Often times you'll see sea level rise expressed as an average over some time period 'x inches in the last y years' or 'an average of x mm per decade since y'. These aren't inherently bad but they can easily be misleading or just non-informative. What we'd really like to know is what the current rate of change is. This can be estimated by considering the mean over a shorter time span, say the last 10 years, but this smaller sample size means our estimate is more likely to reflect shorter term fluctuations rather then the underlying trend. A longer mean will be less biased by short term effects but if our rate of change is itself changing then it will bias us towards the old rate of change.
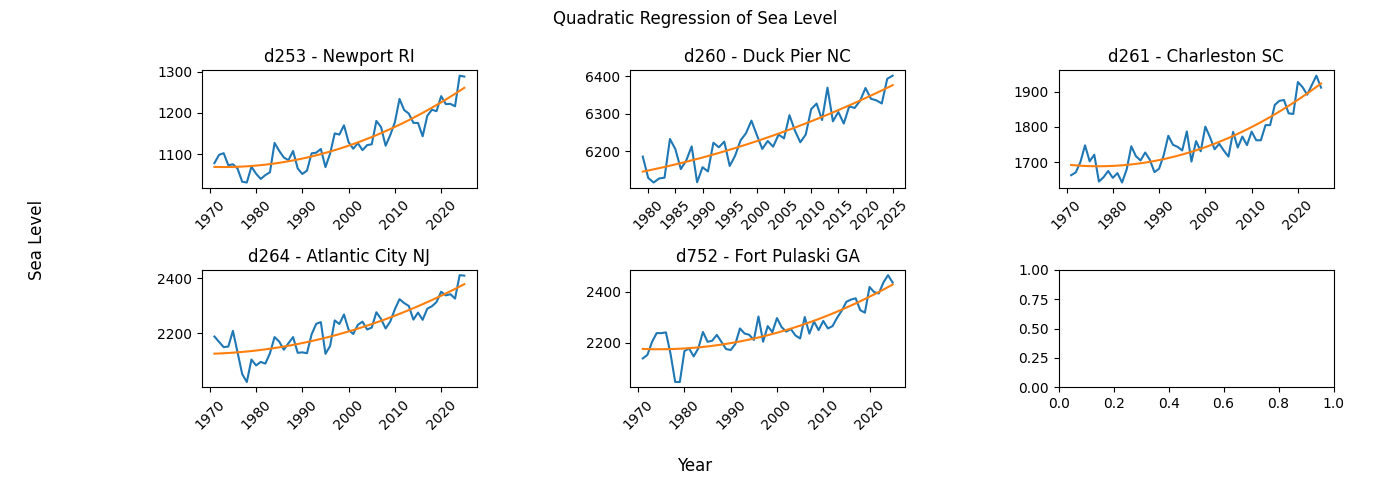
In order to incorporate the whole time series into our estimates we need a more flexible model than. The approach will be to fit a polynomial to each dataset and then derive estimates for acceleration and instantaneous rates of change from that model.
Non-linear fit and acceleration